A lot has been said about the value of data for commercial business, as more and more companies decided to start leveraging data to grow and re-invent their approaches to different aspects of their operations. The retail industry isn’t an exception: with the help of e-commerce, chatbots, and other technologies, retailers have access to vast amounts of data on their customer behavior, sales, and supply chain.
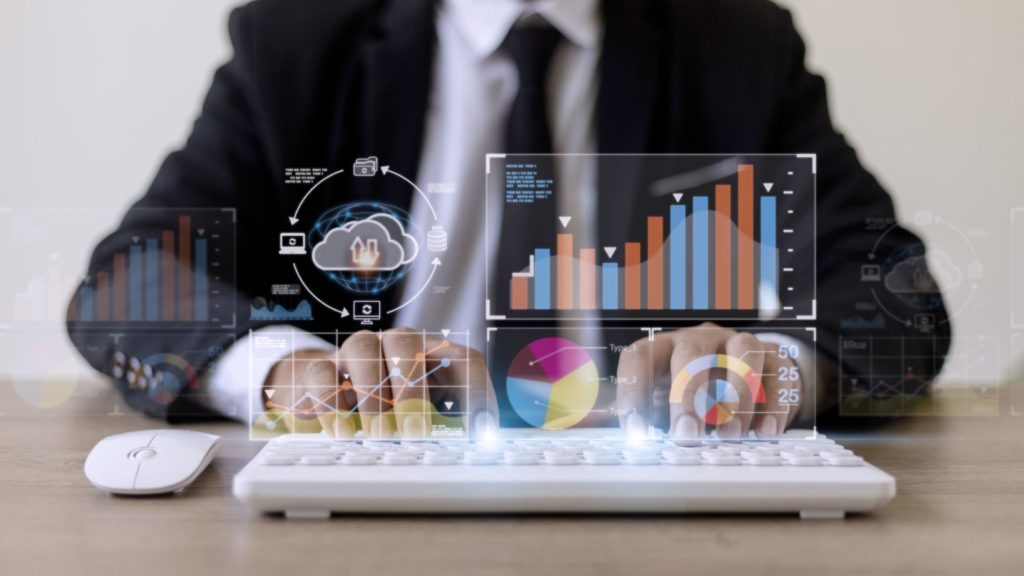
To comprehend valuable insights hidden behind the information they store, retailers need to use data visualization tools. Dashboards would be one of the most convenient and easy-to-understand solutions to visualize data and stay updated on the dynamics of your business performance.
We have collected the list of the 5 most relevant dashboards every retail organization needs to use.
Why Do You Need Dashboards to Visualize Retail Data?

Retailers operate data of different departments: marketing, sales, inventory, logistics, etc. The amounts of available data are huge, and even if you manage to store and process it correctly, you still might not be able to grasp it as a whole, especially if you don’t have a qualified data scientist within your team.
So, your goal is to turn data from a set of numbers into comprehensive reports you can actually understand and use for further decision-making. This task is covered by data visualization.
As a retail company, you should pay attention to dashboards as one of the major tools used for data visualization. They put on display the data you want to monitor, show the changes in dynamics in real-time, and are pretty easy to read for those who don’t have any experience with data science. Dashboards can vary as you wish and present the data on any department or process within your company.
The main value you can get from using dashboards for your retail business include:
- a better understanding of your customers’ behavior;
- detailed insights into how your company operates on any level;
- ability to switch to data-driven decisions and reduce the percentage of assumptions and intuitive guesses;
- real-time updates on your business performance;
- capacity to monitor your business in dynamics and compare current and historical data.
Top Dashboards for the Retail Industry
The retail flow is huge, and the efficiency of every department reflects on the whole success of the whole retail company. Hence, to get a full view of your operations, you must leverage several dashboards that will display different aspects of your business. Here we collected the top 5 that will help you to understand your business better.
Retail Distribution Management
A distribution dashboard will help you to optimize your profitability and detect the most efficient markets and best-selling items. If you are selling your products through different distributors or retailers in different cities, countries, or even parts of the world, this dashboard is a key to understanding where the demand is high, and you have the potential to expand, or what products are in the top for your customers.
Another aspect you can include here is product availability to track the inventory levels in different stores. Why is it important? If the customer demand exceeds the available inventory, you risk losing a sale, and in some cases, even future sales if the customer decided to go to your competitor who will be stocked enough. Visualization of the gap between these two indications will help you to comprehend the number of lost profits and to come up with decisions to mitigate the issue.
E-commerce

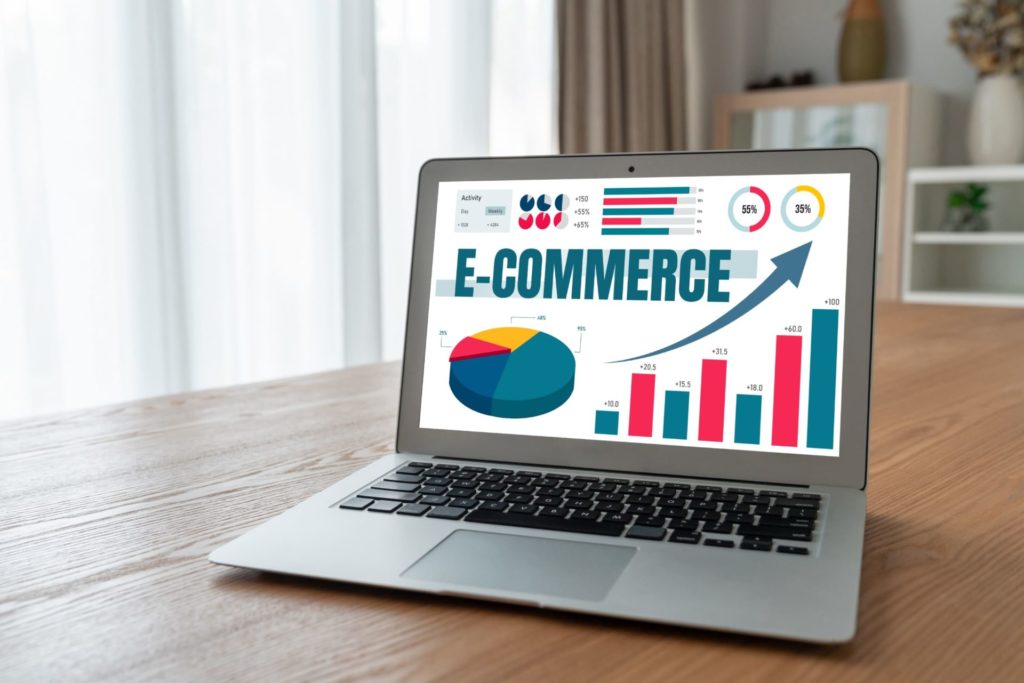
If you sell online, you have a lot of opportunities to discern patterns of your customer behavior and analyze how well your e-commerce store performs. Google Analytics, website integration with CRM systems, or other software solutions you use to manage the online store can monitor the whole customer journey. You can use this data to measure your conversion rates and detect weak spots where you might lose customers.
With the help of advanced data analytics, you can detect certain behavioral patterns and their causes. For example, a lot of leading retailers use online shopping cart dashboards to understand the reasons why customers abandon certain products and don’t complete their purchases.
Promotional Optimization
Marketing and promotion need to be carefully monitored and analyzed for retail companies to measure the efficiency of their marketing efforts. Otherwise, you risk investing a lot of money into different marketing actions, and various social media content production, and having zero assurance that your chosen strategy is performing as you want or if it is simply working.
With the help of dashboard visualization, you can compare sales volumes before the promo is launched and after, thus seeing if a certain promo campaign actually delivers any impact. At the same time, you can add charts for other key performance indicators like profitability, product availability, inventory stock, sales volume, and sales value, etc.
The value of such a dashboard is huge, as it allows tracking the full promotion cycle and reacting appropriately in case of a certain strategy goes wrong or, vice versa, it exceeds your expectations and drains your inventory faster than you planned to restock them.
Store Operations
If you have brick-and-mortar stores, you can use dashboards to visualize the performance of each and get an insightful view into the comparison of stores in different locations and the efficiency of the regional management.
So, with this type of dashboard, you can provide local managers with the necessary info to evaluate how well they are working in comparison with other locations by comparing the next data: sales, year growth, traffic, average transaction value, weekday vs weekend sales, space productivity, top-selling brands, etc.
Supply Chain
Nowadays, a lot of industries experience pressure with supply chains and delivery due to increased geopolitical tension all over the world. Visual analytics can help retailers to see new opportunities to leverage them, as well as comprehend potential risks to be ready to mitigate them.
For this dashboard, you will need to use the data of global customer orders, global sourcing, and geopolitical risk. With its help, you can detect regions with available capacities and lower risks where you can migrate your production.
In the same manner, retailers can leverage the supply cost analysis dashboard with the data on production costs to detect regions where they can produce items for less cost.
In Conclusion
The rise of big data, predictive and prescriptive analytics, and other business intelligence solutions has revealed huge potential retailers can leverage. Data visualization helps to grasp that data and actually see value in it.
Truth be told, there are hundreds of dashboards retailers can set up. However, the lack of professional data specialists might become a barrier that will stop your company from accessing the real value of data visualization.
As a part of our data landscape solutions offer, our data specialist can build a data access and visualization strategy, and customize and set up visualization platforms like Tableau or PowerBI to help you make sense of the data you are storing.
Let’s build custom data visualization dashboards for your company.
Our managers will help you to learn the details.
Contact usFAQ
The main 4 types can be described as idea illustration (customer journey map, market opportunity study), idea generation (a board with unstructured ideas created during the brainstorming), visual discovery (charts, statistical models), and everyday dataviz (line charts, bar charts).
Various dashboards would be the best tool for retail data visualization, as they are comprehensive, representative, and customizable for any business and any purpose.


